What Is Share of Local Voice?
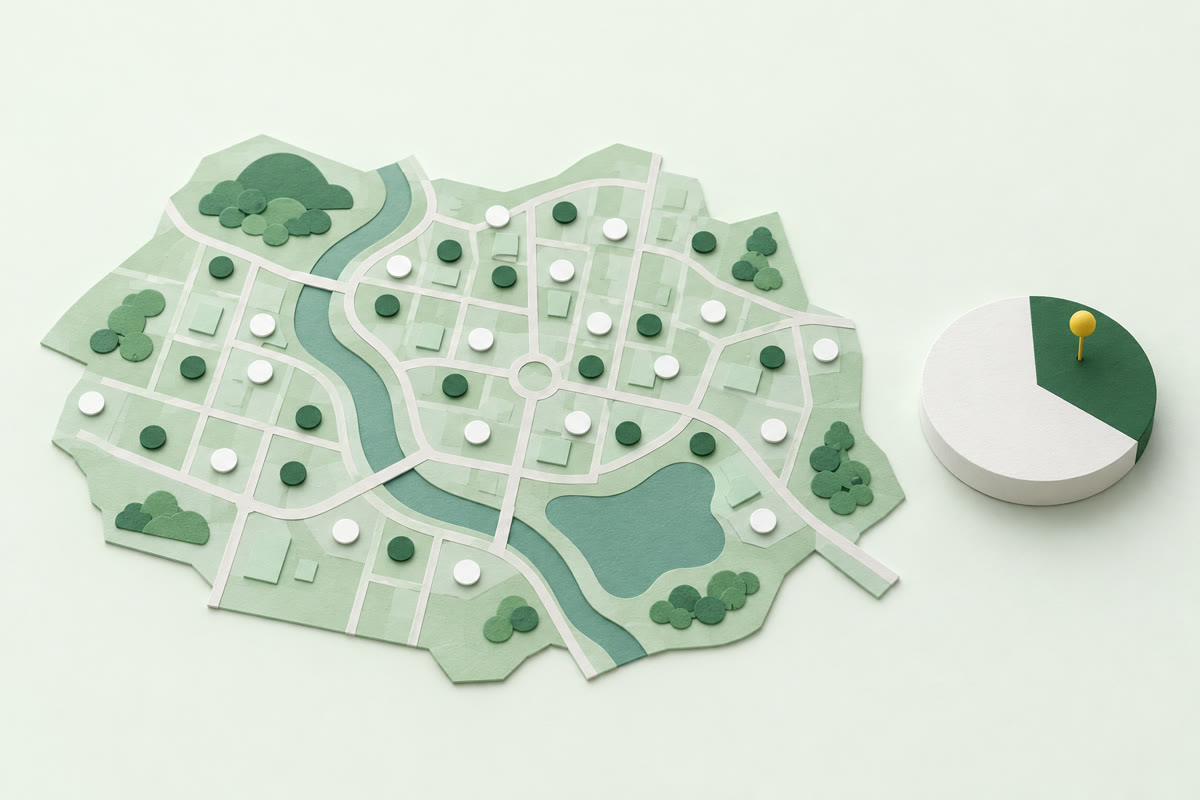
Share of Local Voice is the share of spots in an area where a business is in Google's top 3 map results for a search. The top 3 are the first three businesses a customer sees; on a Google search page, that's the map pack. As of October 2026, each figure covers one Google Maps search across one area, like a UK town, village or postcode district. The share counts whether a business makes the top 3 at each spot, not how close it came.
- What counts: A business counts at a spot only when it's 1st, 2nd or 3rd in Google's map results there, so 4th counts the same as not being found.
- What a spot is: A spot is a point on the map that the search is checked from, as if a customer were searching there.
- Other names: Some reports call the share of spots where a business is in Google's top 3 "top 3 share", and the measure's name is often shortened to SoLV in local SEO (the work of getting a business higher in Google's local results).
- Not the marketing share of voice: Share of voice in marketing is a brand's share of mentions, ad impressions or clicks against its rivals, a different measure with nothing to do with spots on a map.
How is Share of Local Voice worked out?
Share of Local Voice is worked out as the spots where a business is in Google's top 3 divided by every spot checked, multiplied by 100. Spots where the business isn't found at all still count in the total. The sum needs one scan: a single Google Maps search checked from spots across the whole area. So each search, such as "plumber" or "boiler repair", has its own figure.
Here's an example, not a scan. A business is checked for one search from 40 spots and comes up in the top 3 at 12 of them. Its top 3 share is 12 out of 40, or 30%. Now say 8 of those 40 spots don't show the business at all. The share is still 12 out of 40, or 30%. Leaving those 8 spots out would make it 12 out of 32, or 37.5%. That number looks better, but it hides 8 places where a customer searching wouldn't see you.
Say the same business is also checked for "emergency plumber" and is in the top 3 at 4 of the same 40 spots, which is 10%. That's a second figure, not something to blend with the first. An average of 20% would describe neither search and would hide which one needs the work. A Local Rank Tracker report calls the figure top 3 share and gives it search by search.
A search from your own address can't stand in for any of this. It checks one spot, and a share worked out from one spot can only be 0% or 100%. And your own phone shows a different picture from the one a customer across town sees.
One scan is also one moment. Google changes its results all the time, so 30% is what the map showed when the scan ran, not a fixed score.
What's a good Share of Local Voice?
A good Share of Local Voice is judged against the businesses in the same scan and your own last scan because the figure depends on the area and the search. A good figure isn't a set percentage: the share changes with how big the area is, how many businesses compete for the search and where your business sits in the area. A percentage from another town or another search tells you little about yours. Compare the share first with the businesses beating you in the same scan, since every business in one scan is checked with the same search from the same spots. Then compare it with your own last scan of that search over those spots.
- Against the businesses in the same scan: A competitor's top 3 share from the same scan is the fair yardstick, and the gap between your figure and the top rival's shows how far behind you are in that area.
- Against your own last scan: Give a change two to four weeks before you scan the same search over the same spots again, and trust a pattern across a few scans more than one jump.
- What 100% means: A business with a top 3 share of 100% is in the top 3 at every spot. Wherever a spot shows three or more businesses, two others are in the top 3 there too, so 100% doesn't leave 0% for everyone else.
- Why a bigger area can lower it: A bigger area adds spots nearer other businesses, and Google ranks local results partly on how far each business is from the customer who's searching, so a business's top 3 share tends to be lower across those spots. Distance is one of three main factors, with relevance and prominence, so the nearest business doesn't always win.
On its homepage, Local Rank Tracker illustrates the comparison with rivals in an example report from a free scan: top rival 62%, second rival 44%, you 31%. Those are the site's own example figures, not a real business's results. On its own, 31% says little. Next to 62%, it says the top rival is in the top 3 at twice as many spots, so that's the business to look at first. In the report, switching the map to a rival shows the spots where it wins, from the same scan, at no extra cost. No figure is good or bad until it sits beside the businesses it's up against.
What do average position, ARP and ATRP mean?
Average position and ARP average a business's Google Maps ranking over the spots where it's in the top 20 and ATRP over every spot, counting the rest as 21. Average Rank Position (ARP) and Average Total Rank Position (ATRP) are the full names some reports use. For all three, a lower number is better. ATRP is never better than average position, because every spot outside the top 20 pulls it towards 21. None of the three counts the spots where a business is in the top 3, which is what top 3 share does.
A good average position with a much worse ATRP usually means a business is strong in part of the area and missing in the rest. For example, an average position of 3.0 with an ATRP of 12.0 over 40 spots means the business is in the top 20 at only 20 of the 40.
Neither average shows where those misses are. Reading each spot's colour on the map does. The colours Local Rank Tracker gives each spot follow four bands: green for the top 3, amber for 4 to 10, red for 11 to 20 and grey for not found, marked "20+".
Google Search Console's "average position" is a different number: a website's average place in Google's normal search results, not on the map.
Why can your average position improve while your Share of Local Voice doesn't?
Your average position can improve while your Share of Local Voice doesn't because the average also counts rankings from 4th to 20th, which the share ignores. Average position leaves out every spot where you're outside the top 20, so dropping out at your weakest spots can make the average better. The share counts every spot checked, so it changes only when you move into or out of the top 3 at a spot. The gap between the two figures comes from how each is worked out, not from a change at Google. So a better average position on its own doesn't mean more of your area sees you in the top 3.
An example with made-up numbers, not a scan: one search checked from 40 spots. Before, the business is in the top 3 at 10 spots (around 2nd), 4th to 10th at 10 (around 7th), 11th to 20th at 10 (around 15th) and not found at 10. The next scan could go three ways.
| Before | (a) Weak spots drop out of the top 20 | (b) Weak spots climb to around 7th | (c) The other way | |
|---|---|---|---|---|
| Spots in the top 3 | 10 | 10 | 10 | 15 |
| Top 3 share | 25% | 25% | 25% | 37.5% |
| Average position | 8.0 | 4.5 | 5.3 | 10.0 |
| Spots not in the top 20 | 10 | 20 | 10 | 0 |
In (a), the 10 weak spots, where the business was around 15th, drop out of the top 20. Average position improves from 8.0 to 4.5 and the share stays at 25%, yet the business is now missing at 10 more spots. ATRP gets worse, from 11.25 to 12.75, because each lost spot counts as 21.
In (b), those 10 spots climb to around 7th instead. Average position improves to 5.3, and the share stays at 25%.
Example (c) runs the other way. Five of the spots around 7th climb to 3rd, and the 10 not-found spots come in at around 18th. The share rises to 37.5%, while average position gets worse at 10.0, because the new spots count in the average.
So read both numbers when you track your Google Maps rankings.
Which number should a business owner watch?
Business owners should watch top 3 share for how much of their area sees them in Google's top 3, and average position for how high they rank where they appear. The top 3 are the first three businesses a customer sees: on a Google search page, the map pack shows them with a map, and the rest sit behind "More places". Average position, read next to the number of spots where the business isn't in the top 20, shows whether it's moving up below the top 3 or missing altogether. Watch top 3 share to see whether more of the area sees the business, and check average position when the share stays flat. Neither number counts calls: both show only where the business ranks, not who gets in touch.
Calls are counted in Google Business Profile's Performance report, which is Google's own set of figures for your profile. It counts them as taps on the call button, along with direction requests and website clicks. None of its metrics is a ranking position. It only covers verified profiles, and its figures include actions from Google Ads as well as the normal results. So if you run Google Ads, some of the calls it counts can come from them. Local Rank Tracker leads its reports with top 3 share because, in its view, the top 3 are the results that get most of the calls. Put your top 3 share next to the Performance report's calls month by month. If both go up in the same month, that only shows they moved together, not that one caused the other.
How do you find your own Share of Local Voice?
Finding your own share of spots in Google's top 3 map results takes one scan that checks your main search from spots across your whole area. Local Rank Tracker doesn't charge for one full scan a month: your town, village or postcode district, up to 81 spots, with the full report, for just your email and no card. The report gives the figure as top 3 share, with average position and the spots checked beside it.
Paid Local Rank Tracker plans check your searches every week, and for each change you record, "Did it work?" sets your top 3 share before the change against your share after it. Rankings also move for reasons nobody controls, so it shows what happened, not what caused it.